Research note
Where does training capacity fall short of projected need?
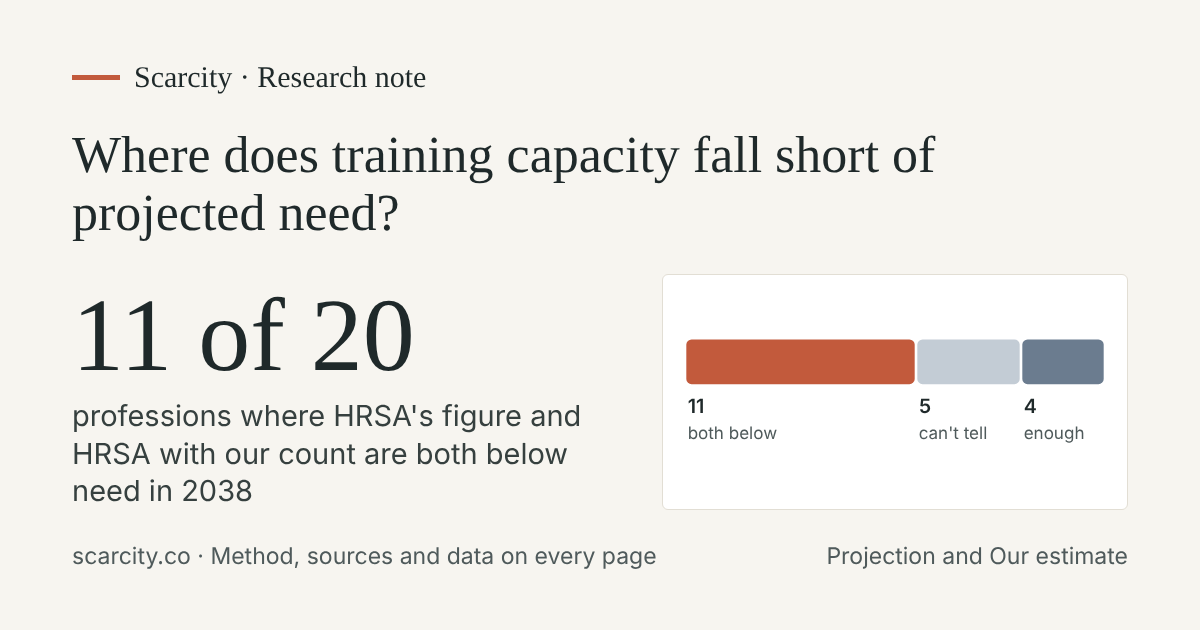
HRSA projects 20 of these professions. For 11, HRSA's own 2038 figure and HRSA with our count are both below 100% of need. For 4, both are at or above it. For 5, they fall on different sides of 100%, so the projection can't tell.
Supply as a share of need in 2038
Both below 100% of need (11)
- Addiction Counselors (Master's Level)Label: WatchHRSA 30%; with our count 37% to 46%
- Clinical and Counseling PsychologistsLabel: SignalHRSA 48%; with our count 41% to 47%
- Cardiovascular TechnologistsLabel: WatchHRSA 58%; with our count 65%
- Marriage and Family TherapistsLabel: WatchHRSA 60%; with our count 64% to 93%
- Licensed Practical NursesLabel: SignalHRSA 70%; with our count 70% to 79%
- Physical Therapist AssistantsLabel: WatchHRSA 80%; with our count 71%
- School CounselorsLabel: WatchHRSA 80%; with our count 83%
- Dental HygienistsLabel: SignalHRSA 83%; with our count 83% to 88%
- Physical TherapistsLabel: WatchHRSA 85%; with our count 82% to 85%
- Respiratory TherapistsLabel: SignalHRSA 92%; with our count 92%
- Radiologic TechnologistsLabel: SignalHRSA 97%; with our count 87% to 97%
On different sides of 100%: can't tell (5)
- Mental Health CounselorsLabel: Not enough evidenceHRSA 55%; with our count 82% to 115%
- PharmacistsLabel: No shortage shownHRSA 92%; with our count 92% to 101%
- Social WorkersLabel: WatchHRSA 95%; with our count 112%
- Registered NursesLabel: Not enough evidenceHRSA 97%; with our count 92% to 104%
- Occupational TherapistsLabel: No shortage shownHRSA 99.5%; with our count 99.5% to 116%
Both at or above 100% of need (4)
- Speech-Language PathologistsLabel: WatchHRSA 106%; with our count 108% to 109%
- Psychiatric Nurse PractitionersLabel: No shortage shownHRSA 108%; with our count 147% to 236%
- Physician AssistantsLabel: No shortage shownHRSA 112%; with our count 113% to 116%
- Nurse PractitionersLabel: No shortage shownHRSA 175%; with our count 146% to 175%
Both below 100%: Clinical and Counseling Psychologists, Addiction Counselors (Master's Level), Marriage and Family Therapists, School Counselors, Licensed Practical Nurses, Physical Therapists, Physical Therapist Assistants, Respiratory Therapists, Dental Hygienists, Radiologic Technologists, and Cardiovascular Technologists. Both at or above: Psychiatric Nurse Practitioners, Speech-Language Pathologists, Nurse Practitioners, and Physician Assistants.
HRSA's figure is a projection: supply as a share of need in 2038, where need means serving people at today's rates of care. HRSA with our count is our estimate: HRSA's 2038 total adjusted for the number of newly trained people we count in place of HRSA's assumption, with 85% of the difference still working in 2038. The lower case assumes 50%. It uses our counts, so it doesn't confirm HRSA's figure on its own. A profession needs more than one source showing a shortage before its label says so; the label rules are on the method page.
The numbers
Show the table
| Profession | HRSA's own 2038 figure | HRSA with our count | Lower case (50%) | Label |
|---|---|---|---|---|
| Clinical and Counseling Psychologists | 48% | 41% to 47% | 44% to 47% | Signal |
| Mental Health Counselors | 55% | 82% to 115% | 71% to 91% | Not enough evidence |
| Social Workers | 95% | 112% | 105% | Watch |
| Addiction Counselors (Master's Level) | 30% | 37% to 46% | 34% to 40% | Watch |
| Marriage and Family Therapists | 60% | 64% to 93% | 62% to 80% | Watch |
| Psychiatric Nurse Practitioners | 108% | 147% to 236% | 131% to 184% | No shortage shown |
| School Counselors | 80% | 83% | 82% | Watch |
| Speech-Language Pathologists | 106% | 108% to 109% | 107% to 108% | Watch |
| Registered Nurses | 97% | 92% to 104% | 94% to 101% | Not enough evidence |
| Licensed Practical Nurses | 70% | 70% to 79% | 70% to 75% | Signal |
| Nurse Practitioners | 175% | 146% to 175% | 158% to 175% | No shortage shown |
| Physician Assistants | 112% | 113% to 116% | 113% to 115% | No shortage shown |
| Physical Therapists | 85% | 82% to 85% | 83% to 85% | Watch |
| Physical Therapist Assistants | 80% | 71% | 74% | Watch |
| Respiratory Therapists | 92% | 92% | 92% | Signal |
| Pharmacists | 92% | 92% to 101% | 92% to 97% | No shortage shown |
| Dental Hygienists | 83% | 83% to 88% | 83% to 86% | Signal |
| Occupational Therapists | 99.5% | 99.5% to 116% | 99.5% to 109% | No shortage shown |
| Radiologic Technologists | 97% | 87% to 97% | 91% to 97% | Signal |
| Cardiovascular Technologists | 58% | 65% | 62% | Watch |
Download this table (CSV). Scarcity's calculations are CC BY 4.0; federal data is public domain; other organizations' figures stay under their terms and are credited on each profession page.
Cite as: Scarcity, “Where does training capacity fall short of projected need?” research note, release 2026-11-17. https://scarcity.co/research/capacity-and-need/ All research notes