Research note
How is training capacity changing?
Of 24 professions, the yearly count of newly trained people rose more than 3% over the decade for 16, fell more than 3% for 7, and stayed within 3% for 1. The largest rise was for behavior analysts (14.4 times the 2013–14 count). The largest fall was for cardiovascular technologists (down 22%).
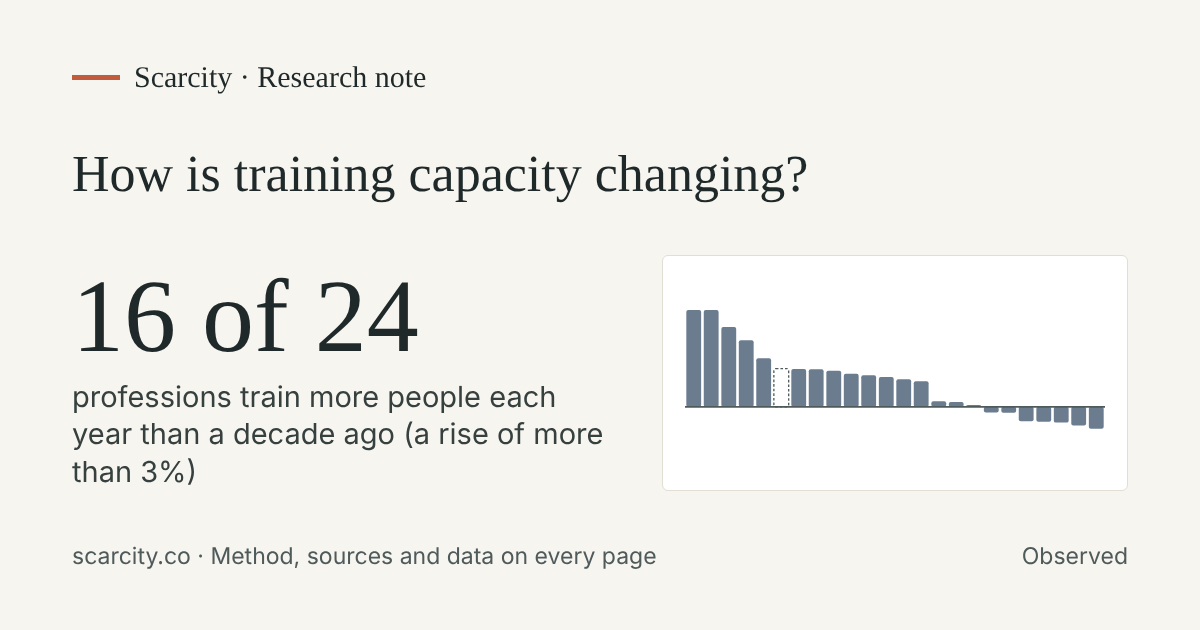
Change in newly trained people per year over about ten years
Rose more than 3% (16)
- Behavior Analysts347 to 4,982 graduates14.4 times
- Psychiatric Nurse Practitioners433 to 4,052 graduates9.4 times
- Physician Assistants6,542 to 11,930 graduatesup 82%
- Occupational Therapists5,808 to 9,797 graduatesup 69%
- Nurse Practitioners19,404 to 29,140 new NPIs listed a nurse practitioner specialty, 2014 to 2025up 50%
- School Psychologists2,306 to 3,219 people finishing programs (our estimate)up 40%
- Social Workers24,566 to 34,196 graduatesup 39%
- Mental Health Counselors14,667 to 20,367 graduatesup 39%
- Speech-Language Pathologists7,737 to 10,636 graduatesup 37%
- Radiologic Technologists7,128 to 9,572 graduatesup 34%
- Physical Therapists8,881 to 11,787 graduatesup 33%
- Marriage and Family Therapists3,088 to 4,041 graduatesup 31%
- Addiction Counselors (Master's Level)440 to 566 graduatesup 29%
- Registered Nurses149,976 to 189,676 U.S.-educated nurses passed the licensing exam, 2014 to 2025up 26%
- Dental Hygienists7,936 to 8,403 graduatesup 6%
- Licensed Practical Nurses50,491 to 53,028 U.S.-educated candidates passed the LPN licensing exam, 2014 to 2025up 5%
Within 3% (1)
- Special Education Teachers29,706 to 30,285 graduatesup 2%
Fell more than 3% (7)
- Clinical and Counseling Psychologists3,017 to 2,843 graduatesdown 6%
- School Counselors12,287 to 11,544 graduatesdown 6%
- Pharmacists13,884 to 11,834 graduatesdown 15%
- ESL Teachers4,767 to 4,029 graduatesdown 15%
- Respiratory Therapists7,580 to 6,344 graduatesdown 16%
- Physical Therapist Assistants6,587 to 5,324 graduatesdown 19%
- Cardiovascular Technologists1,844 to 1,430 graduatesdown 22%
Fell more than 3%: Clinical and Counseling Psychologists, School Counselors, Pharmacists, ESL Teachers, Respiratory Therapists, Physical Therapist Assistants, and Cardiovascular Technologists.
A total can hide a shift inside it. For psychologists, research doctorates (PhD) fell while professional doctorates (PsyD) grew; the psychologist page shows both.
What each count is: most are awards counted in IPEDS, which counts degrees and certificates, not people. For registered and practical nurses, it is people who passed the licensing exam. For nurse practitioners, it is new provider IDs that list the specialty. The years differ by source, and each row says which years it compares. A rise in awards can come from new programs, from schools changing how they report, or from more students.
The numbers
Show the table
| Profession | What is counted | First year | Latest year | Change | Kind |
|---|---|---|---|---|---|
| Behavior Analysts | graduates | 347 in 2013–14 | 4,982 in 2023–24 | 14.4 times the 2013–14 count | Observed |
| Psychiatric Nurse Practitioners | graduates | 433 in 2013–14 | 4,052 in 2023–24 | 9.4 times the 2013–14 count | Observed |
| Physician Assistants | graduates | 6,542 in 2013–14 | 11,930 in 2023–24 | up 82% | Observed |
| Occupational Therapists | graduates | 5,808 in 2013–14 | 9,797 in 2023–24 | up 69% | Observed |
| Nurse Practitioners | new NPIs listed a nurse practitioner specialty | 19,404 in 2014 | 29,140 in 2025 | up 50% | Observed |
| School Psychologists | people finishing programs | 2,306 in 2013–14 | 3,219 in 2023–24 | up 40% | Our estimate |
| Social Workers | graduates | 24,566 in 2013–14 | 34,196 in 2023–24 | up 39% | Observed |
| Mental Health Counselors | graduates | 14,667 in 2013–14 | 20,367 in 2023–24 | up 39% | Observed |
| Speech-Language Pathologists | graduates | 7,737 in 2013–14 | 10,636 in 2023–24 | up 37% | Observed |
| Radiologic Technologists | graduates | 7,128 in 2013–14 | 9,572 in 2023–24 | up 34% | Observed |
| Physical Therapists | graduates | 8,881 in 2013–14 | 11,787 in 2023–24 | up 33% | Observed |
| Marriage and Family Therapists | graduates | 3,088 in 2013–14 | 4,041 in 2023–24 | up 31% | Observed |
| Addiction Counselors (Master's Level) | graduates | 440 in 2013–14 | 566 in 2023–24 | up 29% | Observed |
| Registered Nurses | U.S.-educated nurses passed the licensing exam | 149,976 in 2014 | 189,676 in 2025 | up 26% | Observed |
| Dental Hygienists | graduates | 7,936 in 2013–14 | 8,403 in 2023–24 | up 6% | Observed |
| Licensed Practical Nurses | U.S.-educated candidates passed the LPN licensing exam | 50,491 in 2014 | 53,028 in 2025 | up 5% | Observed |
| Special Education Teachers | graduates | 29,706 in 2013–14 | 30,285 in 2023–24 | up 2% | Observed |
| Clinical and Counseling Psychologists | graduates | 3,017 in 2013–14 | 2,843 in 2023–24 | down 6% | Observed |
| School Counselors | graduates | 12,287 in 2013–14 | 11,544 in 2023–24 | down 6% | Observed |
| Pharmacists | graduates | 13,884 in 2013–14 | 11,834 in 2023–24 | down 15% | Observed |
| ESL Teachers | graduates | 4,767 in 2013–14 | 4,029 in 2023–24 | down 15% | Observed |
| Respiratory Therapists | graduates | 7,580 in 2013–14 | 6,344 in 2023–24 | down 16% | Observed |
| Physical Therapist Assistants | graduates | 6,587 in 2013–14 | 5,324 in 2023–24 | down 19% | Observed |
| Cardiovascular Technologists | graduates | 1,844 in 2013–14 | 1,430 in 2023–24 | down 22% | Observed |
Download this table (CSV). Scarcity's calculations are CC BY 4.0; federal data is public domain; other organizations' figures stay under their terms and are credited on each profession page.
Cite as: Scarcity, “How is training capacity changing?” research note, release 2026-11-17. https://scarcity.co/research/training-capacity/ All research notes